
Business Intelligence Guide for Workforce Management
Discover how to improve your workforce planning with Business Intelligence, integrate GDPR compliance, and easily measure your ROI with job.rocks.
Imagine a scenario in an event agency where the phone keeps ringing, three employees cancel at short notice, and the dispatch team works with Excel sheets, WhatsApp messages, and gut feeling. By the end of the day, no one clearly knows who was available, which shift is still open, and why the planning has faltered again. This is exactly where Business Intelligence steps in, because it turns scattered data into a clear basis for decisions. Anyone who wants to manage their processes more cleanly will also find useful connections to this topic in tips for process digitization.
Table of Contents
- Introduction to Business Intelligence
- Historical Development of Business Intelligence
- Business Benefits and Workforce Management KPIs
- Practical Examples for Event Hospitality and Staffing
- Implementation Roadmap for Business Intelligence
- GDPR and Compliance for BI in Switzerland
- Integration with job.rocks and ROI Measurement
- Conclusion and Next Steps
Introduction to Business Intelligence
When three temporary workers cancel shortly before a trade show in an event agency, a nice dashboard alone is not enough. You need numbers that show who is available, which skills are missing, and which shifts are still open. Business Intelligence helps you build a clear picture from individual signals that you can use for planning, deployment, and quality assurance.
Getting started often seems complicated but is basically simple: you collect data, compare it, and derive decisions from it. For workforce teams, this includes availability, cancellations, deployment duration, qualifications, and feedback from the team. Once this data comes together, you recognize patterns that you would otherwise overlook in daily operations. It’s like a paper schedule where only the markings reveal where gaps arise and where reserves still exist.
Practical rule: First the question, then the dashboard. If you don’t know which decision you want to support, BI only produces pretty pictures without benefit.
This perspective is especially important in Switzerland because teams often work with flexible pools, changing locations, and multiple languages. In such environments, reading only historical reports is not enough; you must ask operational questions: Who can step in today? Where are skills missing? Which shift is at risk due to cancellations? For companies wanting to organize their processes more clearly, a clean process framework also fits, because BI quickly reaches its limits without reliable inputs.
BI becomes particularly useful when you align it to concrete KPIs for workforce planning. These include short-term cancellations, open shifts, occupancy rate, qualification coverage, pool reaction time, and how quickly a request actually turns into a confirmed deployment. In Swiss practice, a second perspective is added: which data you are allowed to collect at all and how you justify it properly when used for planning, documentation, or billing.
In the end, it’s not about technology for technology’s sake. It’s about understanding what is happening faster in stressful situations and making calmer decisions. That is why BI is so valuable for flexible employee pools, especially when you need to keep personnel, quality, and time windows in view simultaneously, and when you want to measure later whether the effort pays off in better processes and a traceable ROI.
Historical Development of Business Intelligence
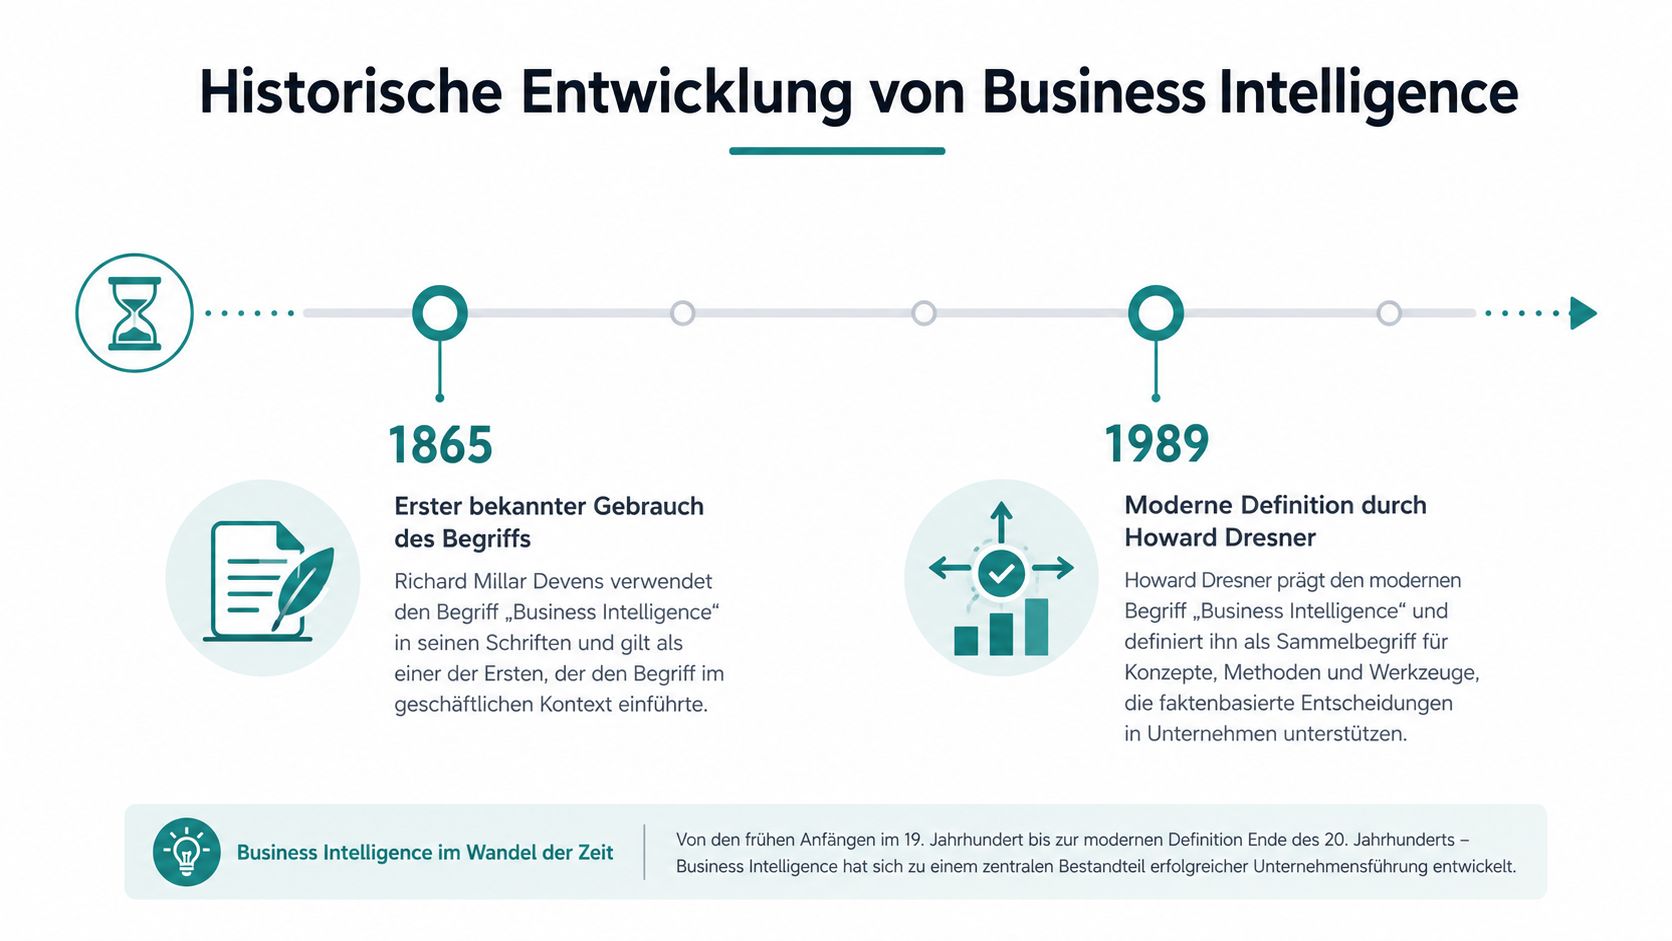
The history of Business Intelligence does not begin with modern dashboards but with language and observation. In 1865, Richard Millar Devens used the term “Business Intelligence” in the Cyclopædia of Commercial and Business Anecdotes, and in 1989 Howard Dresner at Gartner coined the term as an umbrella for fact-based decision systems, as the historical overview by CIO on the development of Business Intelligence shows. Between these two points lies a very long journey from occasional information use to systematic decision support over more than 120 years.
From Notebook to Dashboard
In the past, teams often collected numbers in folders, spreadsheets, or in the minds of individuals. This worked as long as there were few orders and changes were rare. In a flexible deployment environment, this model immediately fails because availability, cancellations, and payroll preparation constantly change.
Today, the same logic looks different. A dashboard aggregates data instead of someone manually gathering it from three sources. This creates a direct transition from pure description to clean support for planning and control.
Why This Development Matters for Swiss Companies
In Swiss companies with changing deployments, the historical shift is not just an academic topic. It explains why modern BI tools must do more than monthly reports. They must show in a timely manner where action is needed and organize data so that teams can compare it despite decentralized structures.
Old forms of analysis often answered what has already happened. BI also asks what you should do now.
For workforce teams, this means BI does not start as a luxury but as a response to speed and complexity. Those who only review retrospectively often notice bottlenecks too late. Those who continuously bring data into a shared picture can react earlier and plan more cleanly.
Business Benefits and Workforce Management KPIs
Shift planning quickly falls apart if you observe too many KPIs at once. In everyday life, a few clearly explained values help more than broad reporting that no one in dispatch really reads. A good BI setup therefore shows you whether employees are available, how quickly open deployments are filled, and where cancellations, waiting times, or inconsistencies occur. The SECO labor market statistics report an average of around 41,000 reported open positions per month in 2024, highlighting the pressure on ongoing data processing. More context can be found in the overview of analytical BI in the labor market.
A KPI is only helpful if you understand its origin. For utilization, you divide occupied deployment time by available deployment time. For the cancellation rate, you relate canceled deployments to all confirmed deployments. For time-to-fill, you measure the time from open deployment to staffing. Team satisfaction can be captured through short, regular feedback because long questionnaires are often answered inaccurately in daily work.
| Workforce Management KPI Overview | Calculation | Target Value |
|---|---|---|
| Utilization | occupied time divided by available time | as stable as possible, without overload |
| Cancellation Rate | cancellations divided by confirmed deployments | as low as possible |
| Time-to-Fill | time from open deployment to staffing | as short as possible |
| Shift Coverage | staffed shifts divided by open shifts | as high as possible |
| Team Feedback | short regular feedback from the team | consistently collectible |
The same number can appear very different depending on the deployment. High utilization sounds positive at first but can also mean your pool is planned too tightly. A short staffing duration only helps if the person also fits technically and linguistically; otherwise, you only solve the problem superficially.
Practical view: A KPI without deployment context easily misleads. Therefore, never compare only values but always also period, location, and deployment type.
Operational control also requires a clear separation between historical reports and short-term signals. Historical reports show where you had weaknesses. Short-term signals show where you need to act today. Those who combine both do not just plan backward but actively steer staffing forward. Those who systematically measure in their own pool also benefit from performance tracking in their own employee pool, because commitments, deployment stability, and reaction times can be compared cleanly.
In Switzerland, additional requirements apply. For personnel in changing deployments, you must build KPIs so that they comply with data protection and internal guidelines. This is especially true when sensitive information is involved in planning. Anyone who wants to keep an overview therefore needs a clean separation between operational deployment data, access-restricted personnel data, and what may actually be visible in reporting. In healthcare, quick help with staffing shortages shows how important this separation is when short-term staffing and reliable documentation come together.
A simple image helps with classification. KPIs are like the dashboard in a car. You don’t need every screw in the engine, but you must immediately see if speed, fuel, and warning lights match the situation. For workforce management, this means BI not only delivers nice overviews but supports concrete decisions, for example in backfilling, dispatch priorities, and the question of whether a deployment still belongs in the same pool or should be organized differently.
Practical Examples for Event Hospitality and Staffing
Three typical environments show well how differently BI can work. In all three cases, it’s not about more data but better questions. The Swiss labor market structure makes this even more visible because in Q2 2025 exactly 5.4% of employed persons worked part-time under 50% and 58.9% worked full-time, increasing planning variability. The figures come from the labor market overview by Market.us for Switzerland.
Event Agency with Last-Minute Cancellations
An event agency often works with tight time windows. A team member cancels, a replacement is only deployable with the right language or experience, and dispatch must react immediately. Here, KPIs like cancellation rate, staffing duration, and skill matching help because they show whether you have enough suitable people in the pool or if planning fails due to a gap.
Hotel Operation with Fluctuating Demand
In hotels, the workload fluctuates strongly depending on arrival time, event, and season. If you only look at standard shifts, you miss the real demand. BI helps here by combining occupancy data, deployment times, and language skills to derive when more employees are needed and which role makes sense in which time window.
Staffing Agency with Fast Booking Rhythm
Staffing agencies often work with very short reaction times. A booking only runs smoothly if availability, qualification, and deployment location quickly match. Recruiters in healthcare or related fields often need very fast help with shortages, and here quick help with staffing shortages is a suitable reference point when it comes to rapid placement under time pressure.
What the Three Examples Have in Common
In all three cases, it’s not the amount of data but the connection of deployment, availability, and quality that decides. If these three levels remain separate, delays arise. If they come together in a clean model, planning becomes calmer and more comprehensible.
Implementation Roadmap for Business Intelligence
A BI project rarely fails because of the idea but mostly due to an unclear sequence. You first need reliable data sources, then a clean model, and only then attractive evaluations. This is exactly how a system is created that is supported in everyday life and does not fade away after a few weeks.
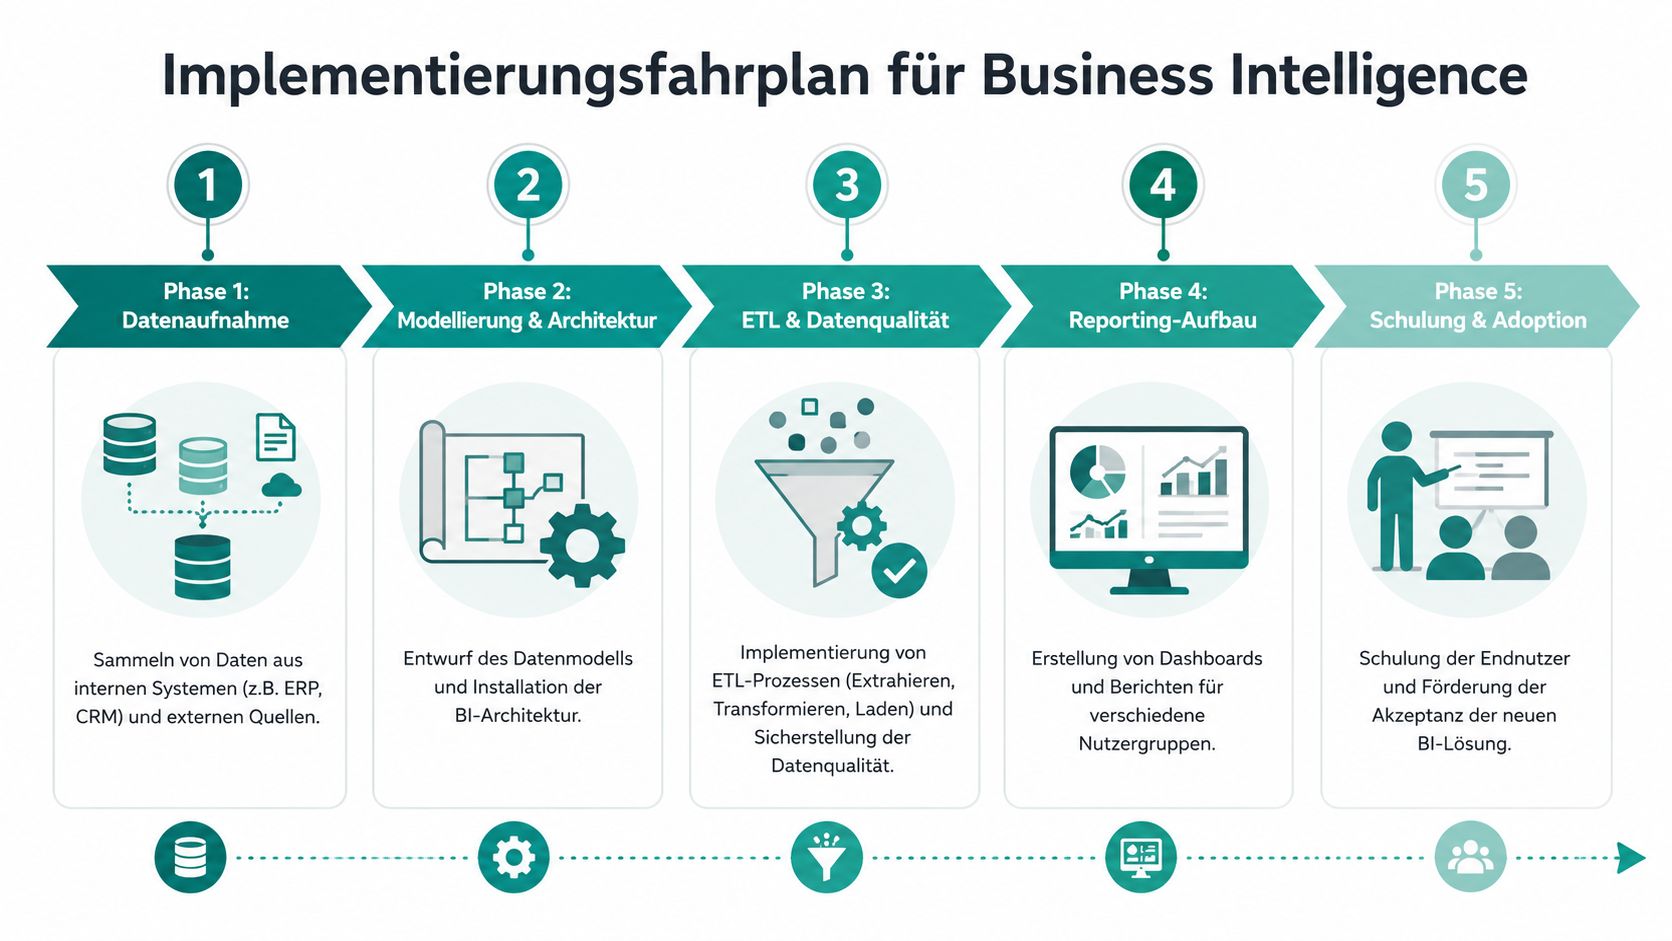
Phase 1 Data Collection
At the beginning are internal sources such as workforce planning, time tracking, payroll preparation, and possibly external market or location data. The goal is not to collect everything but only data that supports a concrete question. A good result of this phase is a list of data sources, their owners, and their currency.
Phase 2 Modeling and Architecture
Now you arrange the data so that time, place, person, and deployment speak the same language. Without this model, duplicate terms, fuzzy fields, and contradictory reports arise. Tools like SQL, a data warehouse, or a lakehouse structure help here as long as the model stands before the surface.
Phase 3 ETL and Data Quality
ETL means extract, transform, and load. In this phase, you check formats, remove duplicates, standardize terms, and secure change states. For example, if employees are spelled differently in several sources, the analysis will fall apart later.
Phase 4 Reporting and Dashboard Design
Only now do you build reports and dashboards. A good dashboard does not show everything but what really matters for dispatch, team leadership, and administration. For operational roles, clear filters, short loading times, and understandable labels are more important than visual effects.
Phase 5 Training and Self-Service
Self-service only helps if people know what they see and what not. Training here does not mean a software tour but a shared understanding of terms, filters, and data limits. This reduces misinterpretations and fewer inquiries to the specialist side.
A dashboard is only useful when a team understands within five minutes which decision to derive from it.
GDPR and Compliance for BI in Switzerland
The Swiss data protection framework was tightened with the revised Data Protection Act and ordinance since September 1, 2023, and internal BI pipelines must demonstrate logging and data security. You can find a detailed classification in the analysis of Swiss data protection on SSRN regarding the revised data protection law. This is especially relevant for workforce data because availability, shifts, and time tracking quickly touch personal information.
What You Should Separate in BI Pipelines
Personal data should not blindly go into every report. You need separation between roles, accesses, and evaluations so that team leaders do not see more than necessary. Aggregated reports are often sufficient for operational management, while detailed data should only be accessible for narrowly defined tasks.
Why Logging Is Non-Negotiable
If you want to trace who has seen or changed which data, you need clean logs. This protects not only legally but also professionally because errors are detected faster. Missing change logs otherwise lead to no one knowing whether a wrong shift came from an import, a typo, or a manual adjustment.
The internal guideline on Swiss Data Protection in Workforce Processes is a good anchor if you want to understand the connection between workforce planning and data protection properly. Especially in shift planning with employee data, availability, and time tracking, data minimization must be considered in the design. BI is only reliable here if it is based on a controlled data foundation.
Integration with job.rocks and ROI Measurement
When you pull shift and availability data from an operational platform into BI, reporting becomes truly useful. You then see not only what was planned but also what actually happened. For technical connection and interfaces, the overview of Integrations and Interfaces is a useful starting point if you want to set up data flows cleanly.
Which Metrics You Can Measure
The whole thing becomes valuable when you compare the same KPIs before and after implementation. Typical metrics are manual planning time, staffing duration, cancellation rate, and time until final approval of a deployment plan. If these values decrease or stabilize, you have a reliable basis for the business case.
For economic consideration, the statutory minimum wage also plays a role because wage costs vary by canton. In Switzerland, the cantonal values in 2025 ranged between 21.00 CHF and 24.48 CHF per hour, depending on the canton, including Basel-Stadt, Jura, Neuchâtel, and Geneva, as shown in the overview of cantonal minimum wages in Switzerland. If you store deployment locations and wage floors properly in the model, the calculation becomes much more realistic.
Simple Calculation Logic for ROI
The formula does not have to be complicated. You compare measurable benefits, such as saved planning time or fewer misplacements, with the costs of the BI solution and ongoing maintenance. It is important that you use the same period and data source for before and after.
If you keep the comparison clean, you don’t have to fudge the ROI. The numbers tell the story themselves.
For implementation, a technical sparring partner is worthwhile when interfaces, data flows, and SaaS systems must work together. This is exactly where experts for IT integration and SaaS help if you want to build interfaces cleanly between planning, reporting, and other systems.
Conclusion and Next Steps
Business Intelligence becomes powerful when you no longer plan by gut feeling but work with clear questions and clean data. For workforce management, this means choosing two to three KPIs that really fit your deployments and consistently tracking them. First check your data sources, then build a small pilot dashboard, and compare the results over several planning cycles.
For further training, topics like data modeling, data protection, and dashboard design help the most. If you keep the first step small, you learn faster which KPIs support your daily work and which only look nice. Afterwards, you can gradually expand the model and adapt it to real deployment situations.
If you want to see how BI can be used in practice for flexible workforce planning, start now with job.rocks and check which of your planning data you can already transfer into a clear dashboard today.