
Quantitative Workforce Planning Example for You
Step-by-step explanation of a quantitative workforce planning example. With formula, calculation example, and tips for your shift planning in a direct tone.
You are about to host an evening event. The guest count is estimated, two part-time employees have not yet confirmed their availability, and cancellations often come precisely when the schedule has already been sent out. In this situation, you don’t need a rough gut feeling but a calculation that combines guest volume, working hours, roles, available personnel, and legal limits.
A quantitative workforce planning example helps you move from expected workload to a concrete shift. First, you calculate the gross demand, compare it with the available current staff, and derive the net demand. Then you check whether your plan works with part-time schedules, last-minute cancellations, and varying workloads.
Table of Contents
- What Quantitative Workforce Planning Means for You
- Formulas and Data Sources You Really Need
- Quantitative Workforce Planning Example for an Event Shift
- Checking Scenarios and Avoiding Common Calculation Errors
- From Quantity Demand to Shift Planning with job.rocks
- Conclusion and Next Steps for Your Planning
What Quantitative Workforce Planning Means for You
At your next event, you need to translate workload into concrete assignments. Quantitative workforce planning answers: How many people and how many working hours do you need for a specific service? For service, cash register, bar, and team leadership, you define how many shifts must be staffed in each time window. Quantity, time, and location are decisive.
Qualitative workforce planning checks the right staffing: Which skills and qualifications must these people have? A server for a formal occasion is not automatically suitable for the cash register. The shift leader needs different knowledge than someone who only helps with clearing tables.
Two Calculations for the Same Event
You plan an event with service, cash register, and a responsible person. Quantitatively, you check how many people are needed simultaneously and how many hours result. Qualitatively, you verify whether at least one person has cash register experience, one person leadership responsibility, and the team enough service practice.
| Question | Quantitative Planning | Qualitative Planning |
|---|---|---|
| Demand | How many people are needed? | Which roles must be filled? |
| Time | How many hours are required? | Which availability fits the time window? |
| Control | Is there an understaffing or surplus? | Is a specific qualification missing? |
| Result | Heads, FTE, and working hours | Roles, skills, and suitability |
Both calculations belong together but remain methodologically separate. You can mathematically have enough staff and still lack an experienced cashier. Conversely, you cover all qualifications but not the additional number of hands needed during entry.
Practical rule: Calculate quantity first. Then check whether the planned people can take on the appropriate tasks.
For your operational planning, the ongoing target-actual comparison also counts. A vacancy rate shows where planned positions or shifts remain open. Part-time schedules make visible that one person in the staff is not automatically available for every time window. Therefore, you regularly compare demand with confirmed availabilities, absences, and actually staffed hours.
The Swiss labor market situation cannot be assessed with a single indicator. SECO uses an indicator system of six metrics, including unemployment rate, vacancy rate, immigration rate, qualification requirements, employment growth, and demographic replacement demand. SECO describes the Swiss indicator system for the labor market situation.
For your planning, this means: You calculate quantitatively as soon as you translate workload, time windows, or staffing plans into people and hours. Then you check roles, experience, and permits. A deeper look at qualitative workforce planning complements quantity calculation with the competence perspective.
Formulas and Data Sources You Really Need
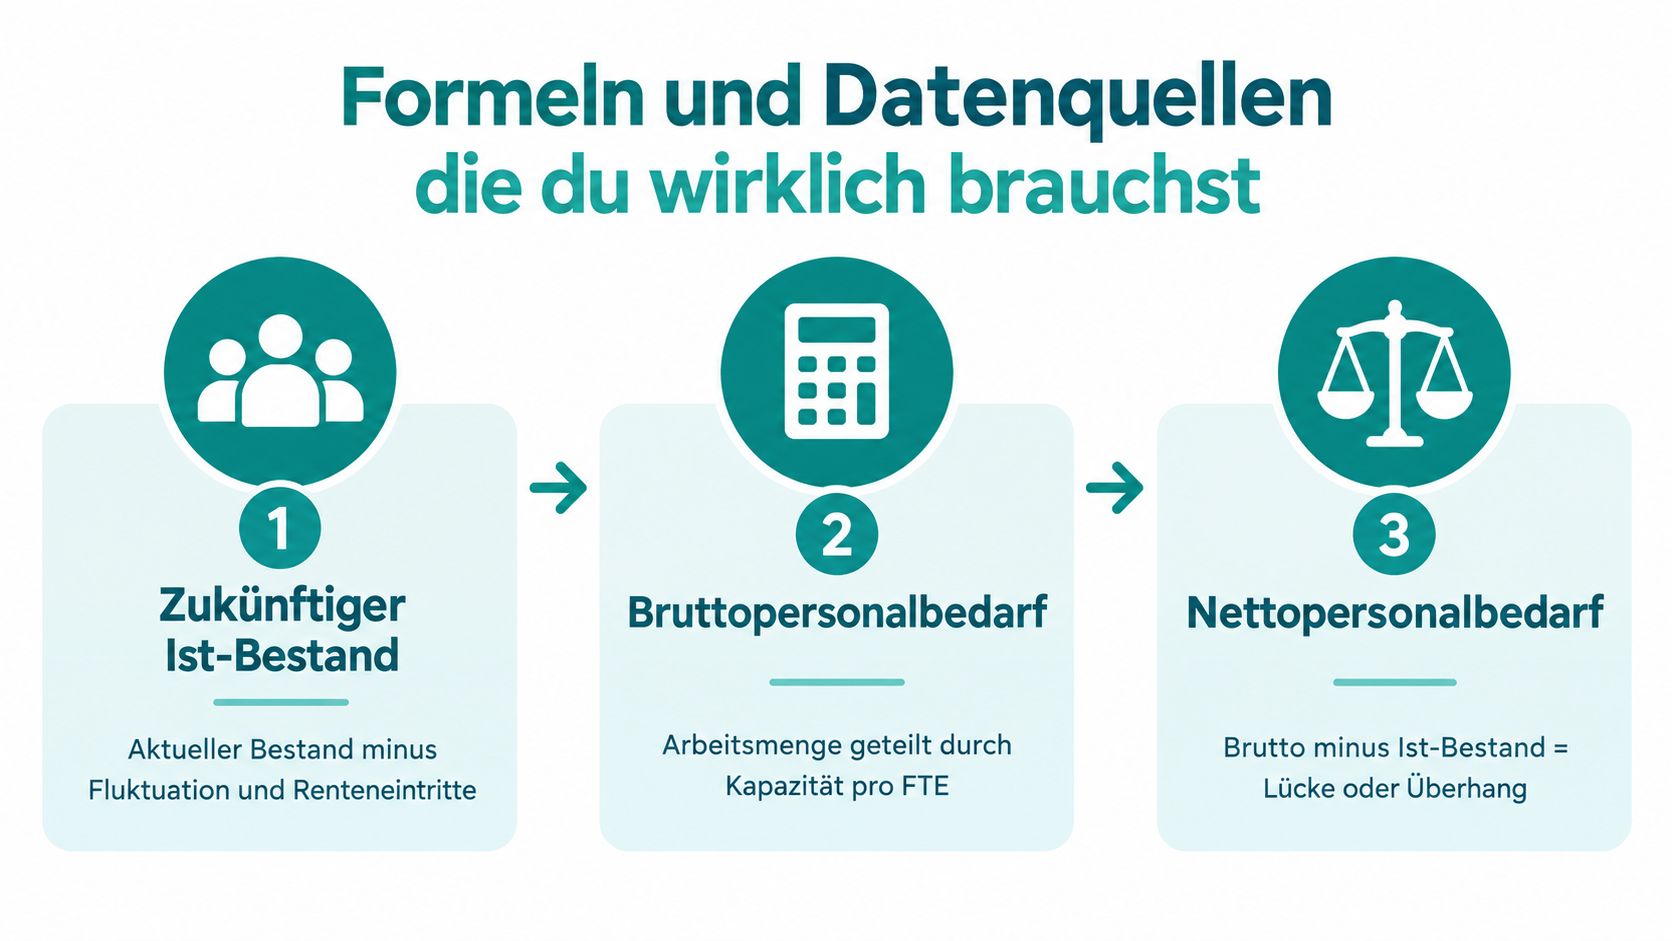
The calculation becomes clear if you conduct it in three stages. You start with the future current staff, then determine the gross personnel demand, and finally calculate the net personnel demand.
Future current staff = current staff minus departures plus additions
Net personnel demand = gross personnel demand minus future current staff
Swiss practice works with FTE, full-time positions, headcount, workdays, and working hours. In an area with rather fixed costs, positions or people can serve as calculation units. With fluctuating workloads, as you know from gastronomy, events, or care, workdays and hours are often closer to real demand. These three stages and their distinctions are also described in the practice of personnel cost planning.
Step One with Current Staff
Do not take the current staff uncritically from a list. Subtract planned departures and add confirmed additions. For an event agency, these can be resignations, vacation absences, returnees, or already confirmed temporary workers.
For shift planning, you also need the actually available capacity. A person with a reduced schedule is not equivalent to a full-time employee when you want to distribute working hours. The Federal Statistical Office reports a part-time employment rate of 38.7 percent for 2024. The FSO data on part-time employment 2024 thus shows why headcount and available hours can differ.
Step Two with Gross Demand
Gross demand describes how much staff you need for service delivery before subtracting your existing staff. A simple hours formula is:
Gross personnel demand in FTE = required working hours divided by available hours per FTE
For a variable event, you calculate better per time window. Four people for five hours are not the same as one person for twenty hours if the event requires simultaneous staffing.
Step Three with Net Result
If you subtract the future current staff from the gross demand, you see the gap or surplus. A positive result shows additional demand. A negative result indicates more planned capacity than needed for the scenario.
Keep assumptions next to the formula. Note guest count, opening time, roles, breaks, part-time shares, expected cancellations, and used capacity. For working time limits, check the Swiss labor law. For the categories mentioned there, a weekly maximum working time of 45 hours applies; for other employees, 50 hours. The SECO overview on working and rest times lists these limits.
An Excel solution can suffice for the start. When working with a template, separate demand, availability, and actual staffing clearly instead of mixing everything in one row. A suitable Excel template for work schedules can serve as a starting point.
Quantitative Workforce Planning Example for an Event Shift
You plan an evening event in a restaurant. 180 guests are expected. Entry starts at 5:30 pm, service runs from 6:00 pm to 10:00 pm, followed by teardown until 11:00 pm.
For service, you assume one person per 30 guests. This number is not a general industry rule but your operational key for this format. You use it only because you know from previous events that plates, drinks, and clearing can be covered with it.
Additionally, you need two people at the cash register or entry, one team leader, and two people for the later teardown. The team leader is not counted as a regular server during service time because they handle inquiries, substitutions, and kitchen contact.
Calculating from Guest Numbers to Roles
The service demand is:
180 guests divided by 30 guests per server = 6 servers
For entry, you plan two people from 5:30 pm to 7:00 pm. The six servers work from 5:30 pm to 10:30 pm to include briefing, setup, and closing. The team leader is on site from 5:00 pm to 11:00 pm. For teardown, two people come from 10:00 pm to 11:00 pm.
| Calculation Step | Assumption | Result |
|---|---|---|
| Guest volume | Expected guests | 180 guests |
| Service ratio | One server per 30 guests | 6 servers |
| Entry | Two people from 5:30 to 7:00 pm | 3 person-hours |
| Service | Six people from 5:30 to 10:30 pm | 30 person-hours |
| Team leadership | One person from 5:00 to 11:00 pm | 6 person-hours |
| Teardown | Two people from 10:00 to 11:00 pm | 2 person-hours |
| Gross personnel demand | Sum of planned working hours | 41 person-hours |
The 41 person-hours form the gross demand for this event. You must deduct breaks depending on shift duration and company rules or plan them as additional coverage. For longer shifts, simply adding presence time is not enough. If a person is unavailable during a break, you need a replacement or a different work distribution for that time window.
From Gross Demand to Net Demand
Your available staff for this event looks like this:
- Four servers are confirmed for five hours each, so 20 person-hours.
- One more server is available for three hours, so 3 person-hours.
- The team leader is confirmed for six hours, so 6 person-hours.
- One cashier is confirmed for one and a half hours, so 1.5 person-hours.
- The second cashier and the two teardown workers are still open.
The confirmed staff thus includes 30.5 person-hours. Compared to the gross demand of 41 hours, 10.5 person-hours are missing.
The headcount result looks different. You need six servers but only five are confirmed. One cashier and two teardown workers are missing. So you have at least four open positions, although the hours calculation shows a gap of 10.5 hours. That’s exactly why you should track heads and hours in parallel.
The missing hours cannot be arbitrarily distributed among existing employees. If you have ten full-time employees, you cannot simply increase their weekly hours beyond the allowed maximum working time. SECO rules specify 45 or 50 weekly hours as limits depending on the category, as described in the previous data source.
Translation into a Shift Mix
From the calculation, concrete shifts emerge:
- Service A to D, each from 5:30 pm to 10:30 pm.
- Service E, 5:30 pm to 8:30 pm.
- Service F, 8:30 pm to 10:30 pm.
- Cash Register 1 and 2, each from 5:30 pm to 7:00 pm.
- Team leadership, 5:00 pm to 11:00 pm.
- Teardown A and B, each from 10:00 pm to 11:00 pm.
The split into Service E and F shows how you can incorporate part-time availabilities without needing one person for the whole evening. At the same time, you check whether handover works. A short shift only makes sense if briefing, handover, and tasks are clearly defined.
For a repeatable calculation, you can check the Catering Workforce Demand Calculator as a calculation aid. The key remains that you control the used ratio, time windows, and actual current staff yourself.
Checking Scenarios and Avoiding Common Calculation Errors
Shift planning remains an assumption until you compare it with actual progress. At events, guest volume, entry speed, and last-minute availability fluctuate. Therefore, check at least three scenarios and perform the target-actual comparison later instead of applying the formula only once.
Three Simple Variants
| Scenario | What You Change | What You Watch For |
|---|---|---|
| Base | Expected guest count and normal cancellations | Is the planned shift mix sufficient? |
| Peak | Higher guest count and more simultaneous work | Where does a gap appear first? |
| Low | Lower demand and shorter shifts | Which shifts can you reduce? |
In the peak scenario, you don’t just add people. Check whether cash register, kitchen, bar, and service are simultaneously more stressed. An additional service shift helps little if the queue forms at entry. Therefore, note for each role which workload the assumption requires.
In the low scenario, you also don’t automatically cut every shift. Team leadership, entry, and teardown may need minimum staffing independent of guest count. Reduce variable roles first and then check whether handovers and breaks still work.
The Most Common Errors in Practice
Confusing headcount with FTE: Five part-time employees may cover fewer hours than three full-time employees. The FSO reports a part-time share of 25.4 percent overall, with 19.6 percent for men and 58.5 percent for women. The FSO labor market data on part-time work shows why you should not derive available time from headcount. Track vacancy rate, confirmed hours, and possible part-time windows separately.
Setting productivity too optimistically: A service ratio only applies under the conditions for which you set it. A formal dinner with long distances requires different assumptions than a buffet with self-service. Write these conditions directly next to the ratio.
Not accounting for cancellations: A requested person does not belong to the secure current staff. Separate confirmed, requested, and canceled persons. After each feedback, update the vacancy rate and check which role in which time window is affected.
Control question: If a person drops out, do you immediately know which role and time window are affected?
Check three points before approval:
- Hours: Do demand and available hours per time window match?
- Heads: Are minimum staffing levels for entry, service, cash register, and leadership met?
- Limits: Do shift duration, breaks, and weekly hours stay within applicable rules?
The labor market situation can change quickly. The KOF Nekton forecast 2025 expects around 400,000 missing workers. KOF Nekton forecast 2025. For your planning, this means: regularly check assumptions, realistically track available part-time hours, and adjust at every deviation. job.rocks supports this ongoing comparison by making open demands and confirmed shifts visible by role and time window.
From Quantity Demand to Shift Planning with job.rocks
The number from your calculation is not yet a schedule. It tells you how many hours or people are missing per time window. For staffing, you then need an order: define role, determine location, create time window, check available people, and confirm the shift.

Building the Shift from the Calculation Sheet
Take each open position from the gross-net reconciliation as its own row. For the event in the example, you don’t just need a list of ten names but separate requirements for service, cash register, team leadership, and teardown. This way, you immediately see whether the gap is a quantity or qualification issue.
For multiple locations, also check travel time. An available server in Basel won’t help you for a shift in Zurich if the time window doesn’t allow switching. For part-time schedules, splitting into shorter shifts is worthwhile if handovers and briefing are planned.
job.rocks can map demand structured by role, number, location, and time window and match availabilities with suitable shifts. According to current product information, this includes availability queries, qualification filters, personalized invitations, shift details, and time tracking. You can find an objective review of the features in the Event Staffing App by job.rocks.
Continuing Calculations After Confirmation
Planning does not end with the invitation. Mark who has confirmed, who is still open, and where a replacement is needed. For a cancellation on the event day, compare the remaining staffing with minimum demand and decide whether to shift a person, extend a shift, or redistribute a task.
For weekly evaluation, a few key figures suffice if you track them cleanly:
- Staffing rate: How many planned positions were confirmed?
- Vacancy rate: Which roles or time windows remained open?
- No-show rate: How often did a confirmed person not show up?
- Hour deviation: How much did planned and recorded hours differ?
The vacancy rate is not just a recruiting metric. It also shows whether your time windows, roles, or locations are hard to fill in the market. The Federal Council describes labor shortage as a situation where demand exceeds available supply. The KOF forecasts around 400,000 missing workers over the next ten years. The Federal Council’s statement on labor shortage provides the overarching Swiss framework.
For a provider of brand and packaging design, you can also see how strongly specialized roles depend on suitable profiles. The Job Offer Brand and Packaging Design by Echt AG is therefore an interesting complementary resource if you need to formulate requirement profiles for specialist roles alongside quantity planning.
Conclusion and Next Steps for Your Planning
Quantitative workforce planning starts with workload and does not end with a number. You determine the future current staff, calculate gross personnel demand, and subtract the staff. The result shows you a gap or surplus in heads, FTE, or hours.
For events and gastronomy, the hours logic is especially important. Part-time schedules, short shifts, breaks, minimum staffing, and last-minute cancellations change the plan. Therefore, check base, peak, and low scenarios before inviting people.
For your next shift planning, proceed as follows:
- Define workload: Note guest count, opening time, setup, and teardown.
- Calculate demand: Separate roles, time windows, heads, and person-hours.
- Check staffing: Control availability, qualifications, part-time extent, cancellations, and working time limits.
If you want to know how to evaluate required roles and skills, switch to qualitative workforce planning. Quantitative calculation answers the quantity question; qualitative review decides on the right person for the task. Update your assumptions after each event with actual hours worked and staffing. This makes every upcoming shift more transparent.
With job.rocks you can transfer your calculated demand by role, location, and time window into shift planning, query availabilities, and document confirmed shifts and working hours. Check out the platform and see how you can structure your next event or gastronomy shift from quantity calculation to staffing.